
The Sales Learning Curve is a concept developed by Mark Leslie, who was the CEO of Veritas, a 90s software storage powerhouse that scaled from revenues of $36 million to $1.5 billion in 5 years. Leslie has sat as a board member on successful enterprise software companies like NetApp, Nutanix, Pure Storage, and Webex.
Leslie uses a logistic function (sigmoid or S-curve) to model sales yield over time within the organization. Sigmoid functions are used in many places: activation function in deep learning networks, probability distributions. Leslie's experiences have shown that organizations typically follow this pattern: initial learning phase of sales, building a repeatable sales process, and finally, scaling the sales process. Not only has this been observed in practice, but there is academic literature (Smaldino, et. al) that has looked at sigmoid functions as a way to model knowledge acquisition curves within a population.
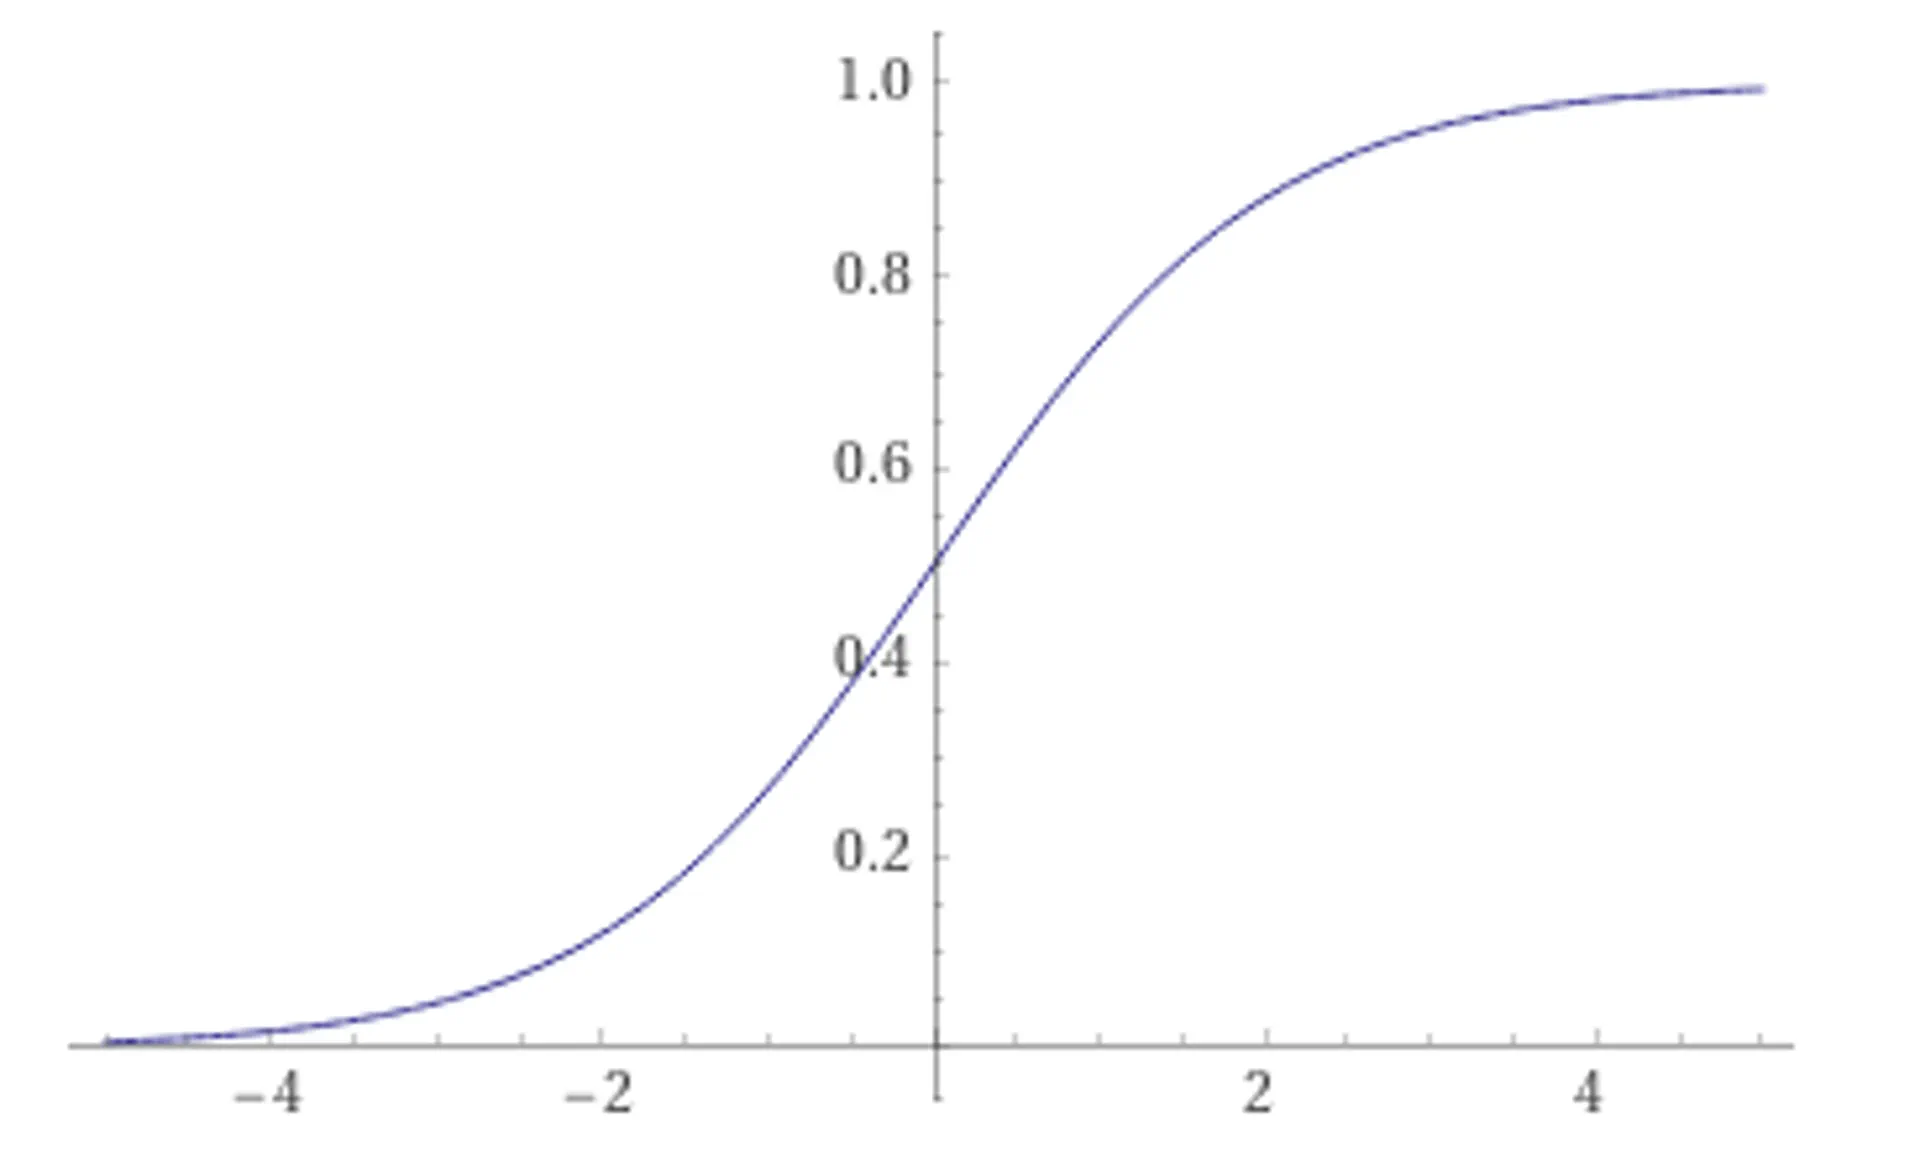
A plot of the logistic function \(g(x) = \frac{1}{1 + e^{-x}} = \frac{e^x}{e^x + 1}.\)
Let's define sales yield. Sales Yield is the average annual sales revenue per full-time, fully trained and effective sales representative.
\[\bar{R} = \frac{1}{N}\sum_{x\in{E}}{r(x)}\]
Where \(r(x_i)\) is the annual sales revenue per employee, and \(E\) is the set of employees. Coming back to the narrative of the curve, we break down the growth of the sales organization into three phases: initiation, transition, and execution.
In the initiation phase of a company, it doesn't make sense to scale the sales organization. The team is still learning how to sell the product, and many early potential customers will need significant incentives to even consider purchasing the product. Leslie explains that this phase ends when sales yield equals the average fully loaded cost per sales rep, or the break-even point.
Coming back to our logistic function for the sales learning curve, let's plot the first and second derivatives.
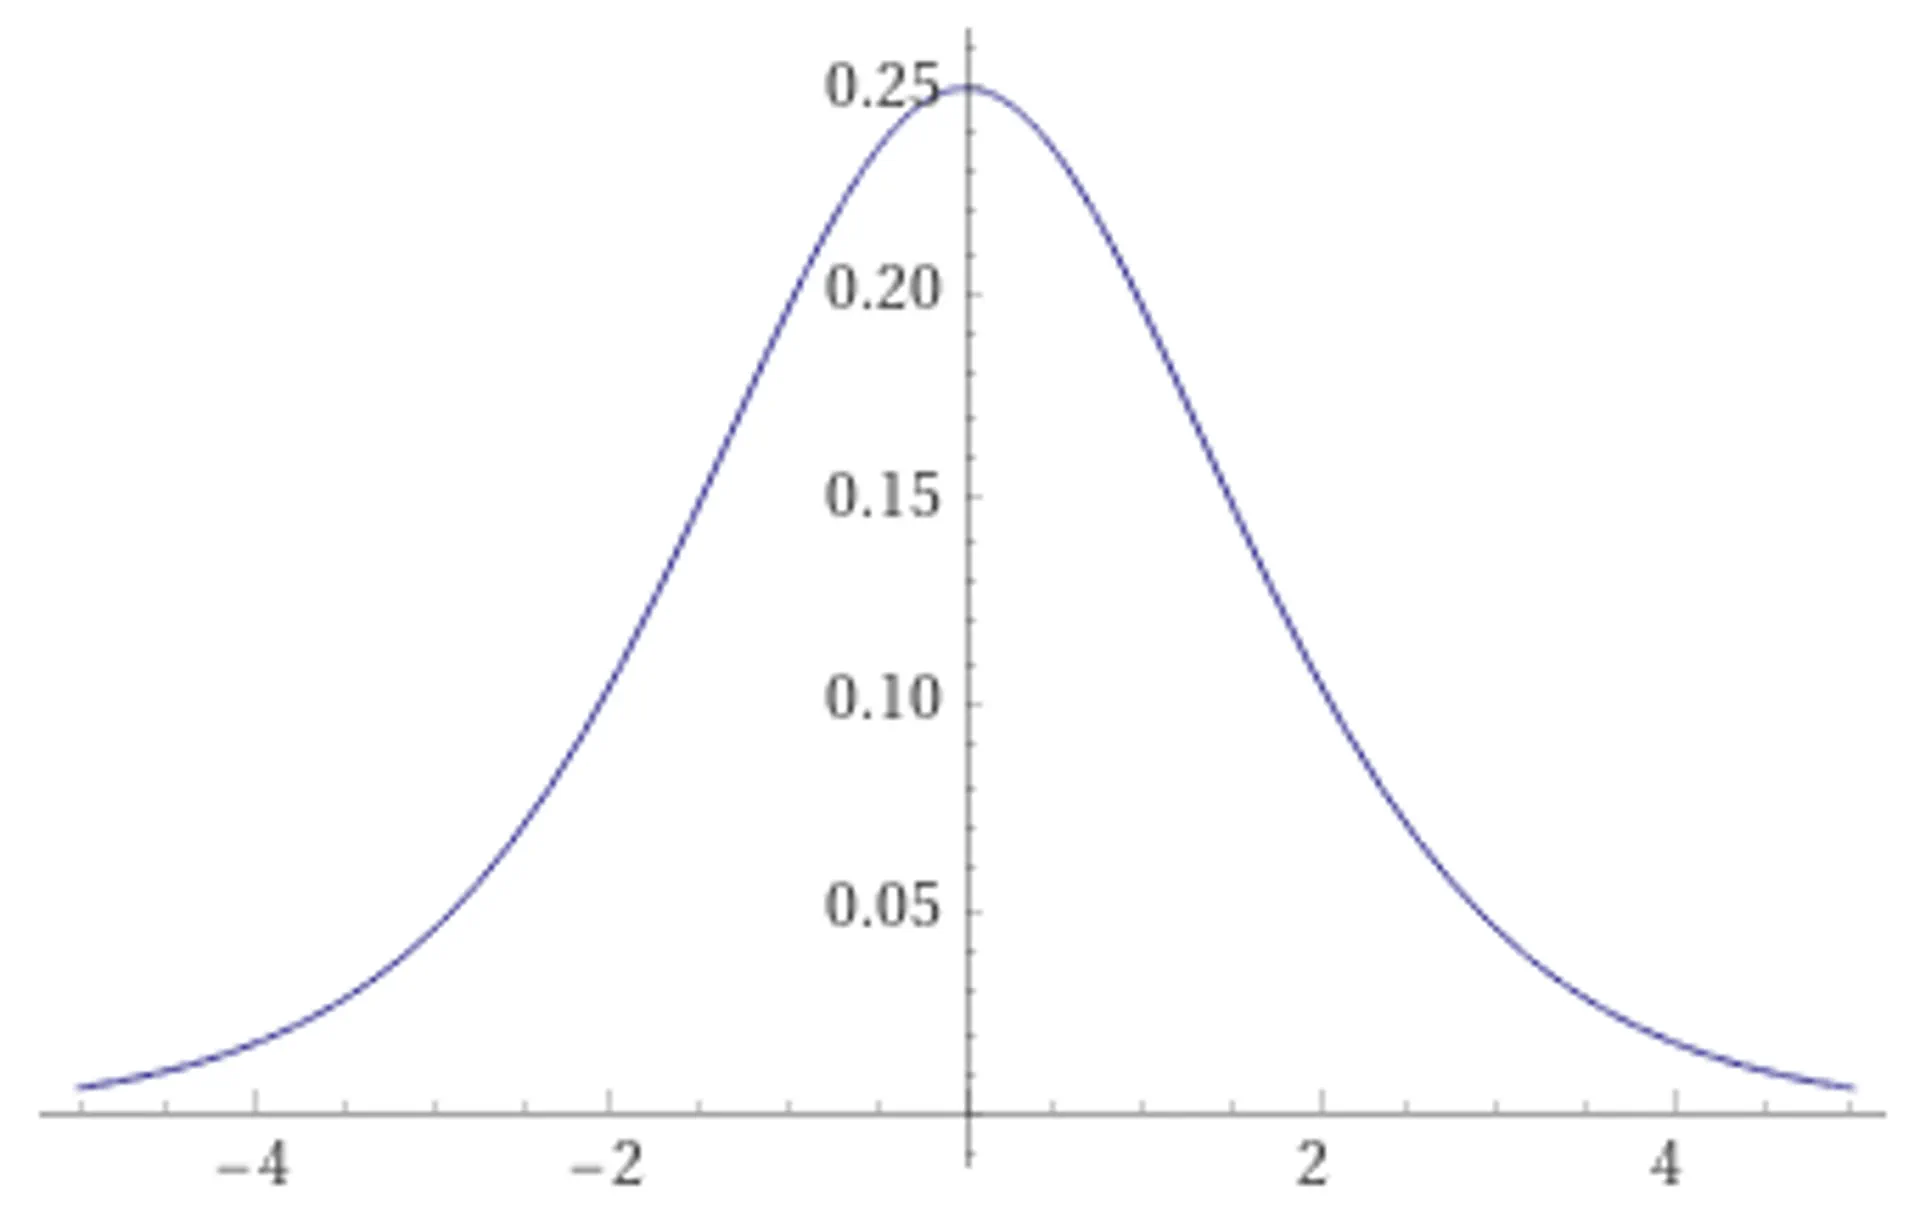
A plot of the first derivative of the logistic function \(g'(x) = \frac{d}{dx}\left( \frac{1}{1 + e^{-x}}\right) = \frac{e^{-x}}{(e^{-x}+1)^2} \)
And the second derivative, which may look familiar if you've read my piece on the productivity paradox
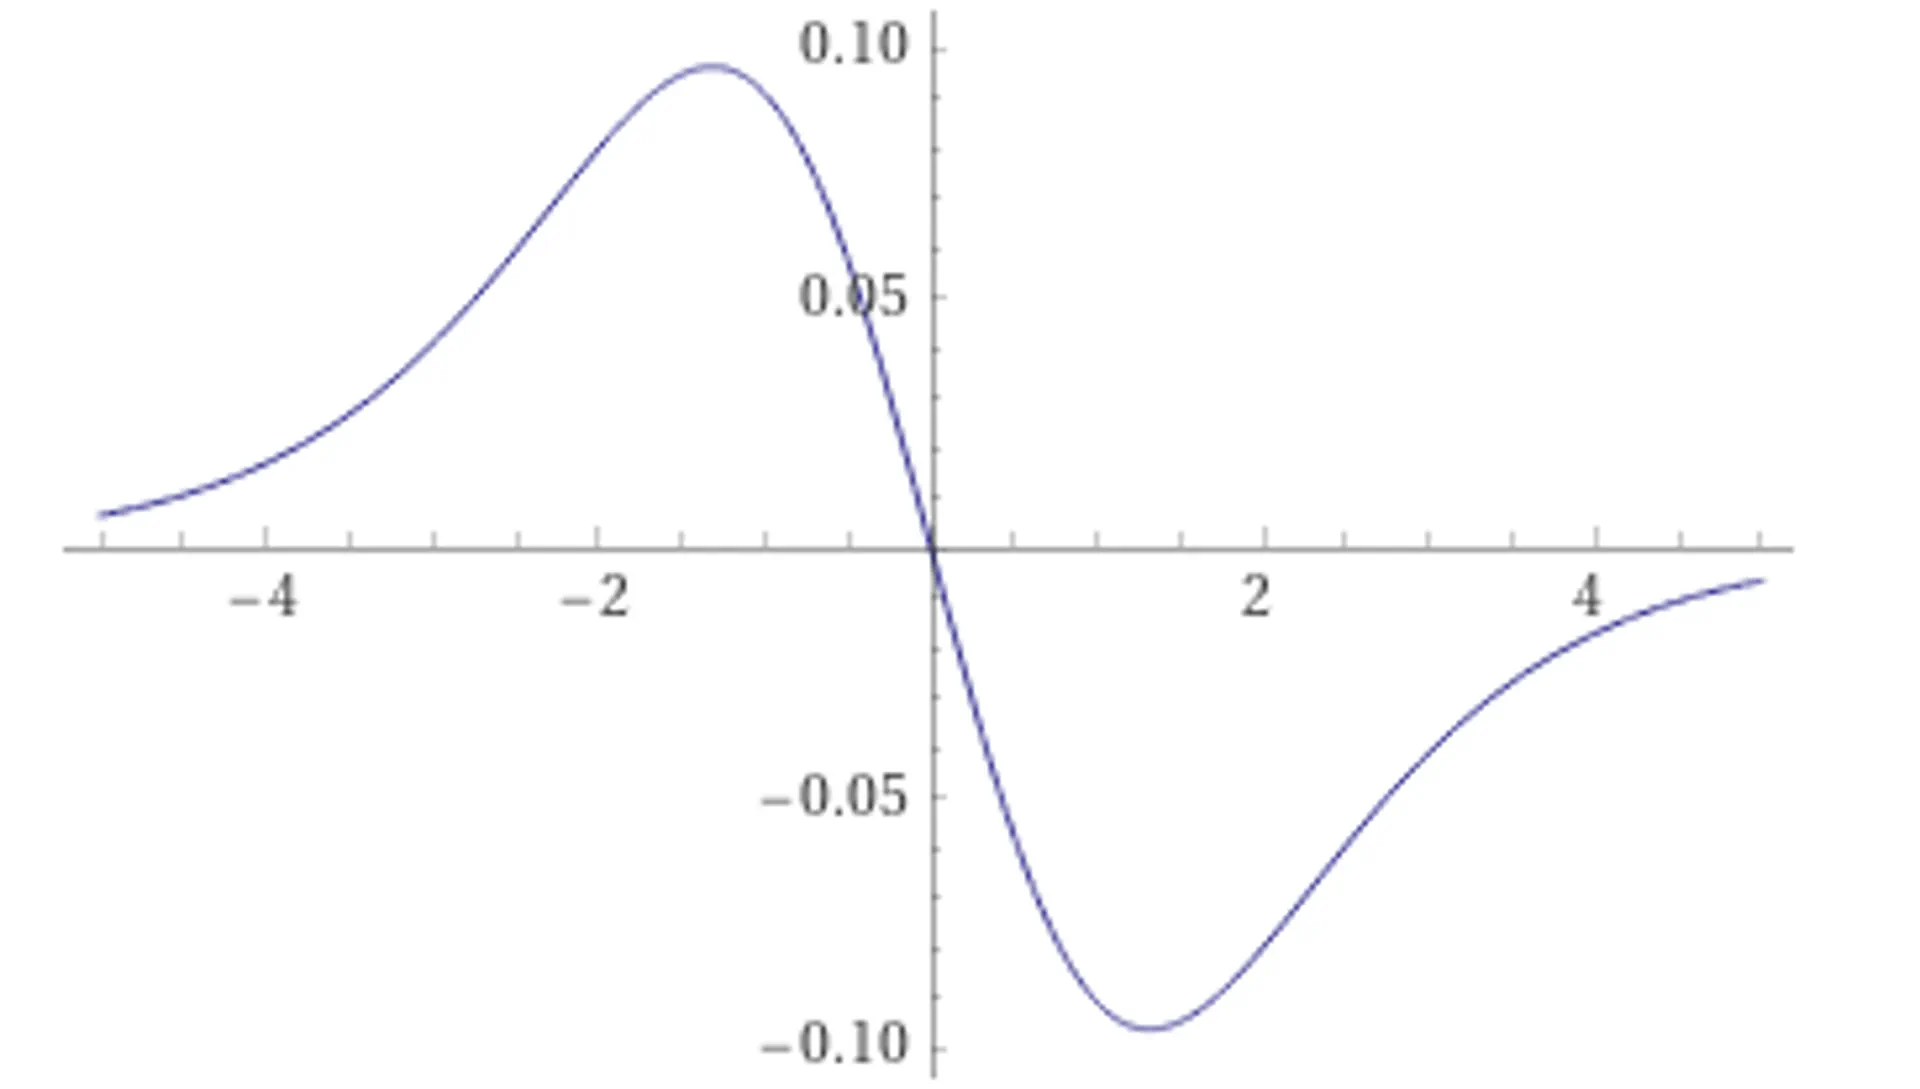
A plot of the second derivative of the logistic function \(g''(x) = g(x)g(-x)(g(-x)-g(x))\) If you're curious about deriving these yourself for fun (or profit), check out this link.
Let's call the first derivative of the sales learning curve to be the organization velocity, and the second derivative to be the organizational acceleration.
A sales organization should transition when organizational acceleration is at its greatest in either direction.
At the first inflection point on \( g''(x) \), the organization has stumbled upon some winning strategy - whether it be product market fit or articulating and solving a specific problem. This is when the rate of change in sale yield is increasing as fast as possible. At this point, the sales organization has entered the transition phase. In this phase, the organization should focus on building a repeatable sales model - continuing to learn new techniques and codifying successful ones in the sales lifecycle.
At the next inflection point on \( g''(x) \), the organization the rate of increase in sales yield is decelerating at its greatest amount. This is the point where the marginal gains from refining the repeatable sales model are slowing. The company is approaching an optimal sales process for their current offerings and the current market. At this point, the sales organization has entered the execution phase. The types of sales representatives at this point should be "coin-operated", that is, a representative that can start selling with a playbook, marketing support, and a territory.
Let's look a Gitlab's sales organization over time.
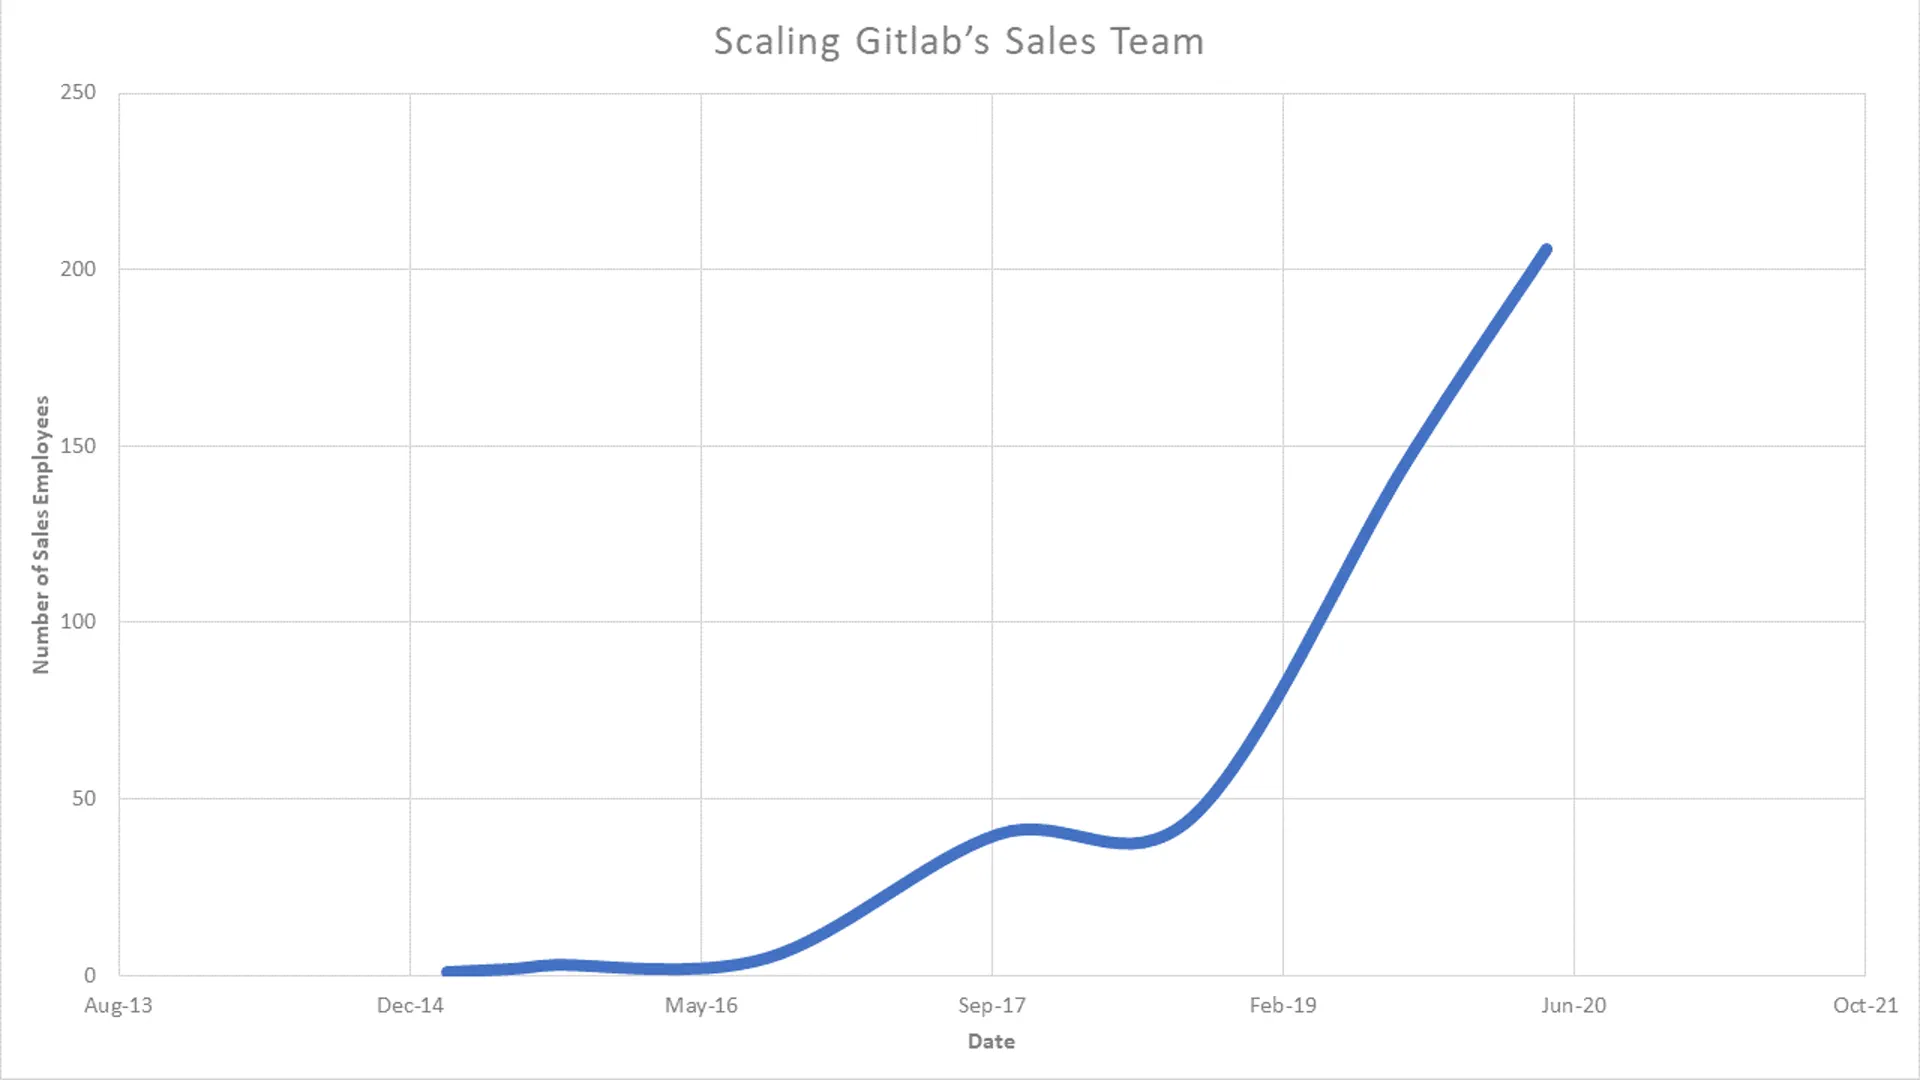
Gitlab's sales team over time. I collected the data by analyzing the Gitlab Employee Handbook, which is open-source and stored on Gitlab. By using the git history, we can see the company at different points in time.
Even though this is a measure of sales organization size and our sales learning curve is sales yield, we can infer some information from this graph. From Dec 2014 to May 2016, you can see that Gitlab hired very few sales people as it was developing its product. The next wave of hiring came between May 2016 and September 2017, after the Series B. This is most likely when Gitlab moved to the transition phase. At around 50 employees, they were developing a repeatable sales model. Finally, you can see for the last year and a half, Gitlab has been hiring sales representatives as quickly as possible. Cross-referencing with the Gitlab open-source sales handbook, the organization has developed a playbook and resources to onboard new "coin-operated" representatives in a repeatable way, entering the execution phase.
Let's look an another example. Jive Software was an enterprise software company that built and sold open-source intranet applications in the early 2000s. They initially grew with a bottoms up adoption with their first few products, not much unlike enterprise companies today that utilize an open source distribution model. However, when they started developing the enterprise solution, they made a near fatal mistake. The open source community provided hundreds of leads, and the team scaled the sales organization in anticipation of the response from the enterprise product. When the product launched, it received a lukewarm response from customers, and the company needed to make midcourse corrections. On top of that, quotas were set too aggressively and a unified sales strategy wasn't set.
Here's a good tweetstorm on the generalized problem, from Martin Casado, a a16z partner who is an enterprise sales expert.
5/ In a common failure mode, the startup builds out sales before figuring out how to scale growth. In this case, sales can outpace the organic growth engine resulting in two entirely different sales pitches, one when the customer knows you, and one when they don’t.
— martin_casado (@martin_casado) December 4, 2018
Where was Jive on the sales learning curve? They thought that they were at the execution phase, but in reality they were in the transition phase. They still needed to learn how to sell the product before they scaled. Unfortunately, this situation unfolded in 2008, at the height of the Great Recession, plunging the company into further uncertainty.
Luckily, the story has a happy ending. The CEO, David Hersh, brought in Bill Lanfri, a former partner at Accel to help with the sales reorganization. Together, they were able to hire a new VP of Sales and made deep cuts to the sales organization. By understanding that they had scaled too quickly, they were able to save the company.